Some features of Excel can be very useful in solving various problems. In the example below you can see some of them:
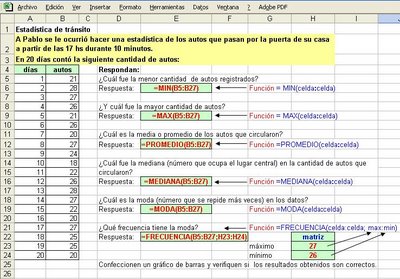
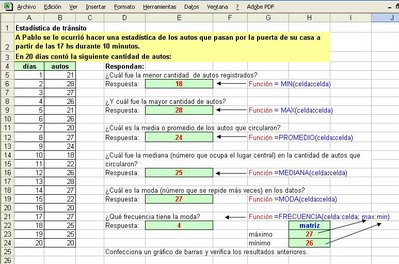
Problem: Paul wanted to make a statistic of the cars that pass through the door of his home after 17 hours. for 10 minutes. In 20 days the following number of cars (shown in the table) Find out: What was the least amount of cars registered? And what's more? , The mean or average of cars circulating, the median, mode and frequency?
used the following functions:
= MIN (first cell: last cell) seeks the minimum value in the range of selected cells.
= MAX (cell: cell) as above but looking for the best.
= AVERAGE (cell: cell) averaged in the range of selected cells.
= MEDIAN (cell: cell) finds the number that occupies the central place in all the selected data.
= MODA (cell: cell) Indicates the number that is repeated more times.
= FREQUENCY (cell: cell, matrix) calculates how many times you repeat a number, this function consists of two parts in the first part up, it indicates the range of cells containing the data, then the matrix may be two cells containing the desired number and the last, for example if you want to search is repeated many times on 12 in cells containing the array is written 12 and 11.
The following image shows the solution of the problem:


